Inventory levels are at a historic low on the Monterey Peninsula. Below is data broken down by year and months for the following cities: Carmel, Pebble Beach, Carmel Valley, Monterey and Pacific Grove.
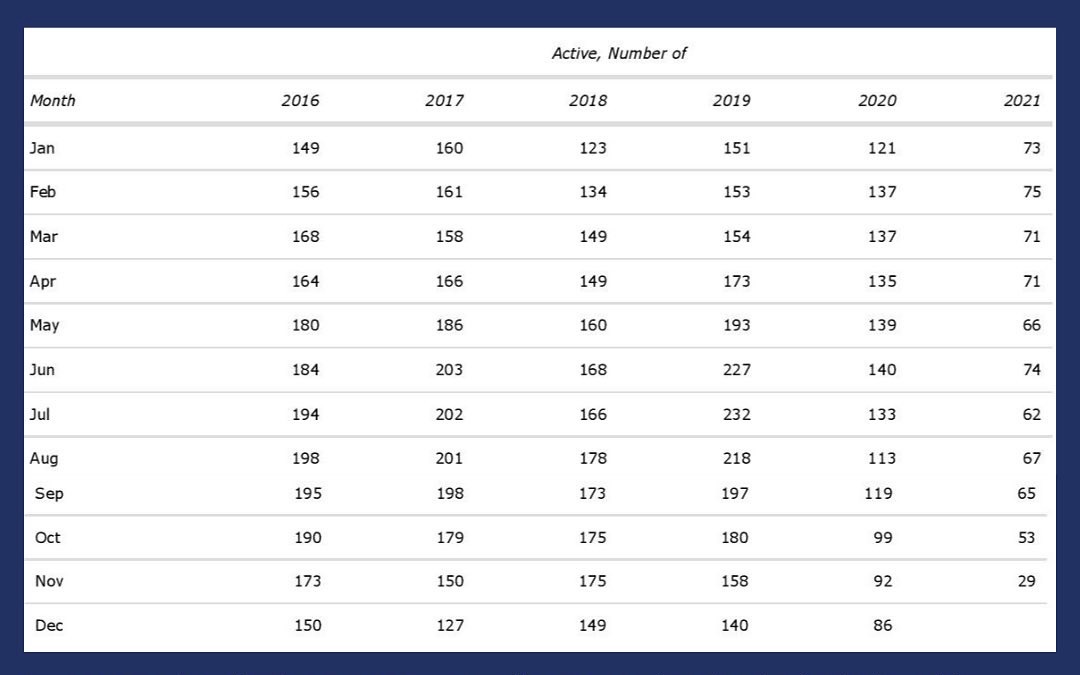
Carmel
Inventory levels the past 5 years has remained relatively level in Carmel with a few peaks and valleys. Inventory started to drop in 2020, however we saw a significant drop in inventory levels in 2021.
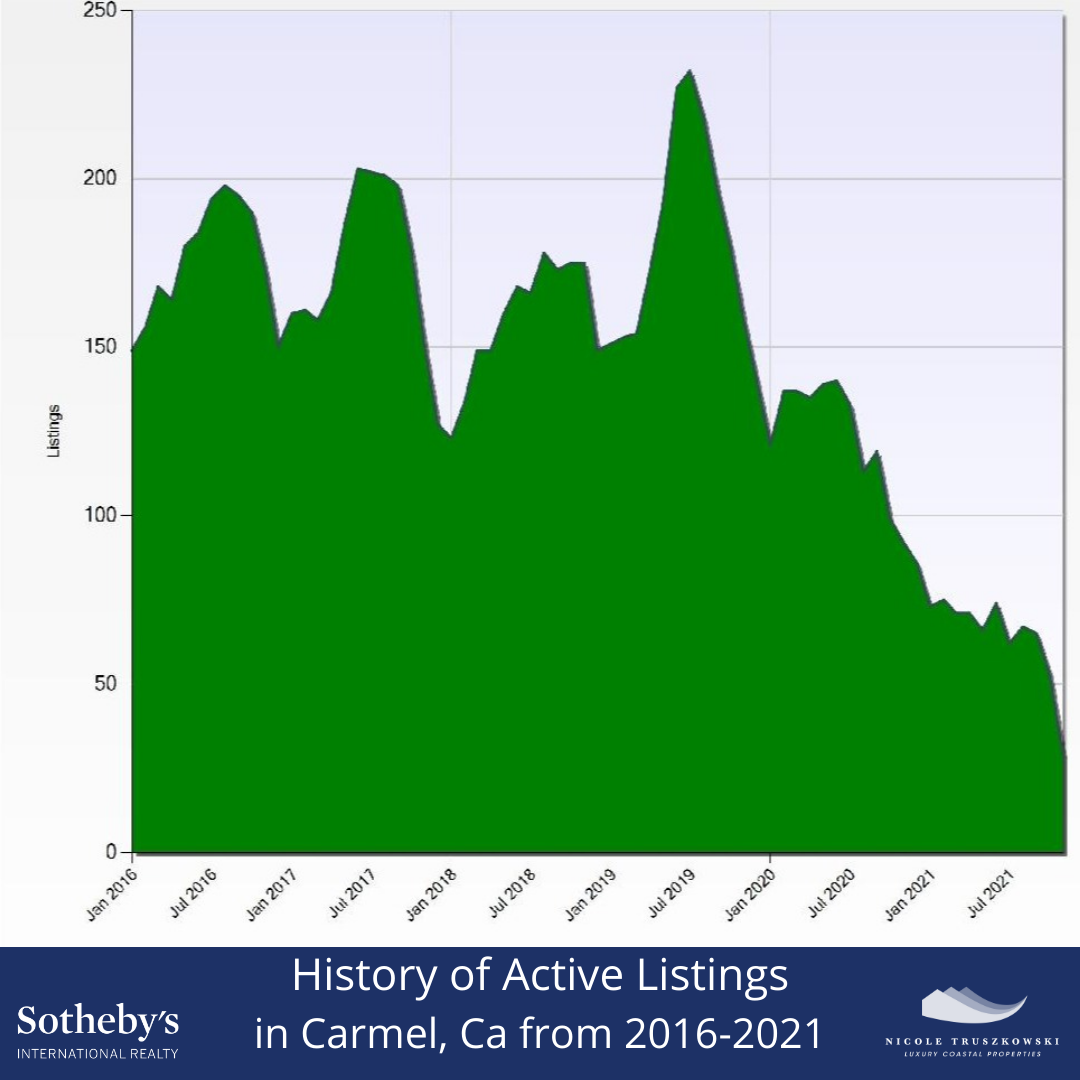
Inventory levels are running approximately 63% lower than the typical norm.
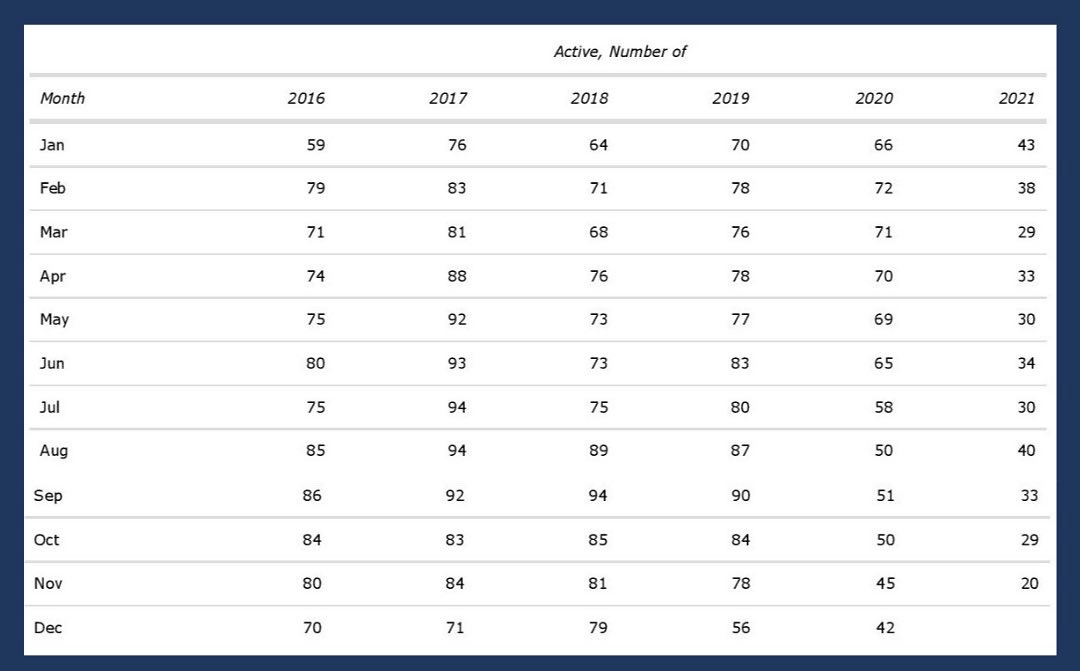
Pebble Beach
Pebble Beach inventory levels peaked in July of 2017 with 94 active listings.
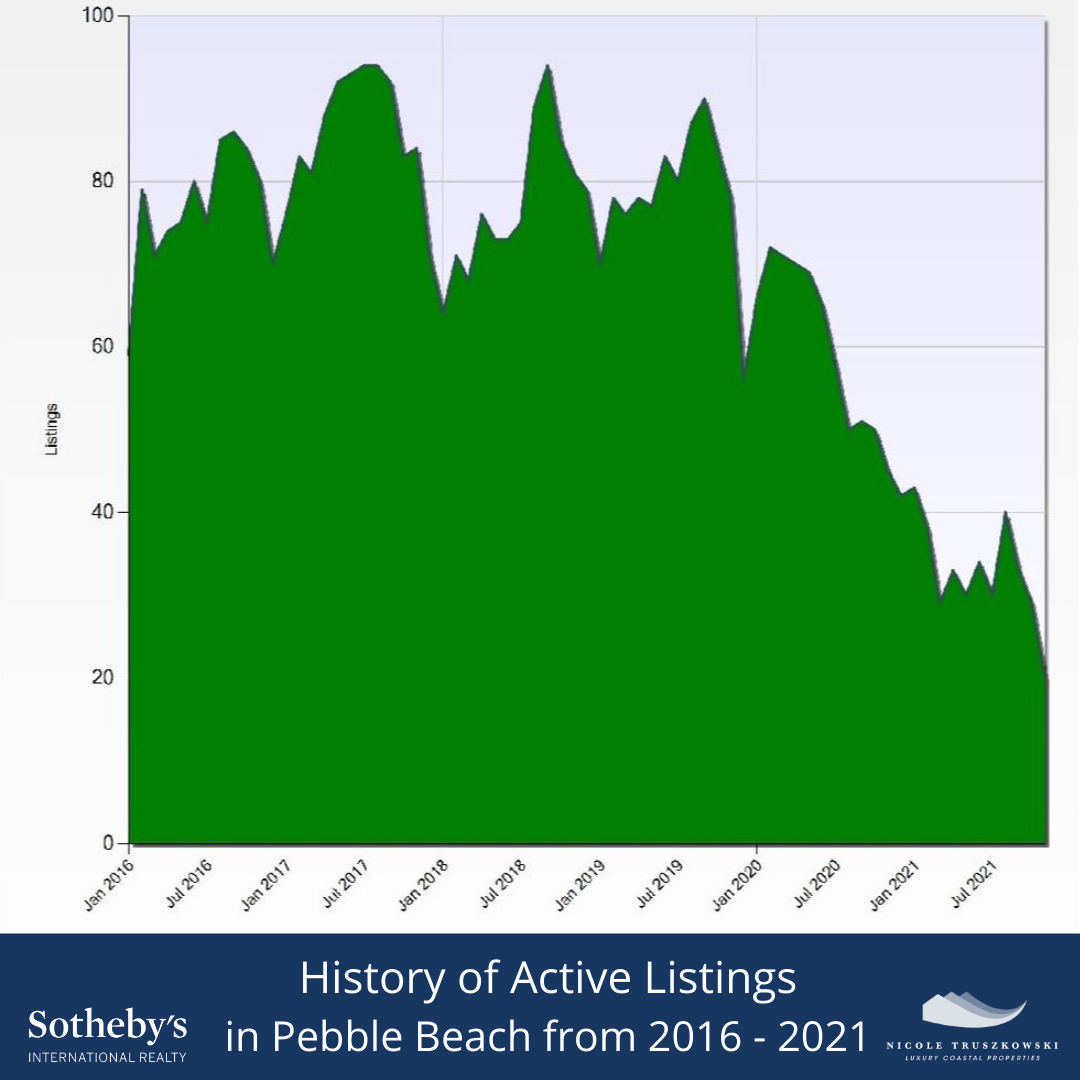
Inventory levels for 2021 on average are down approximately 68%.
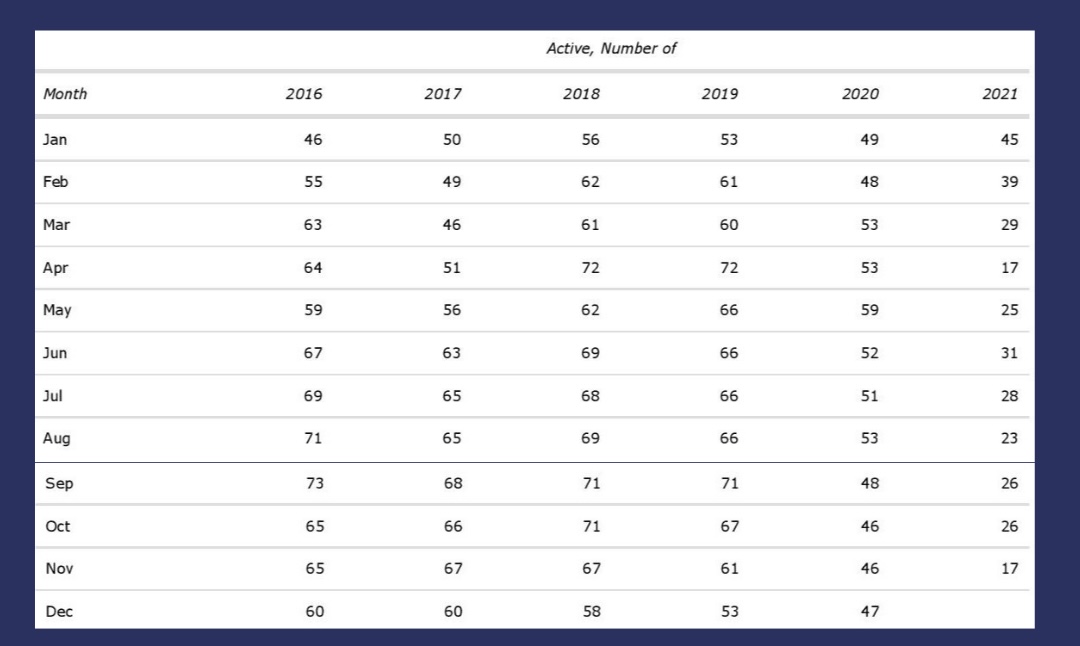
Carmel Valley
Looking at the graphs you can see that inventory in Carmel Valley generally ebbs and flows with active listings peaking in 2018.
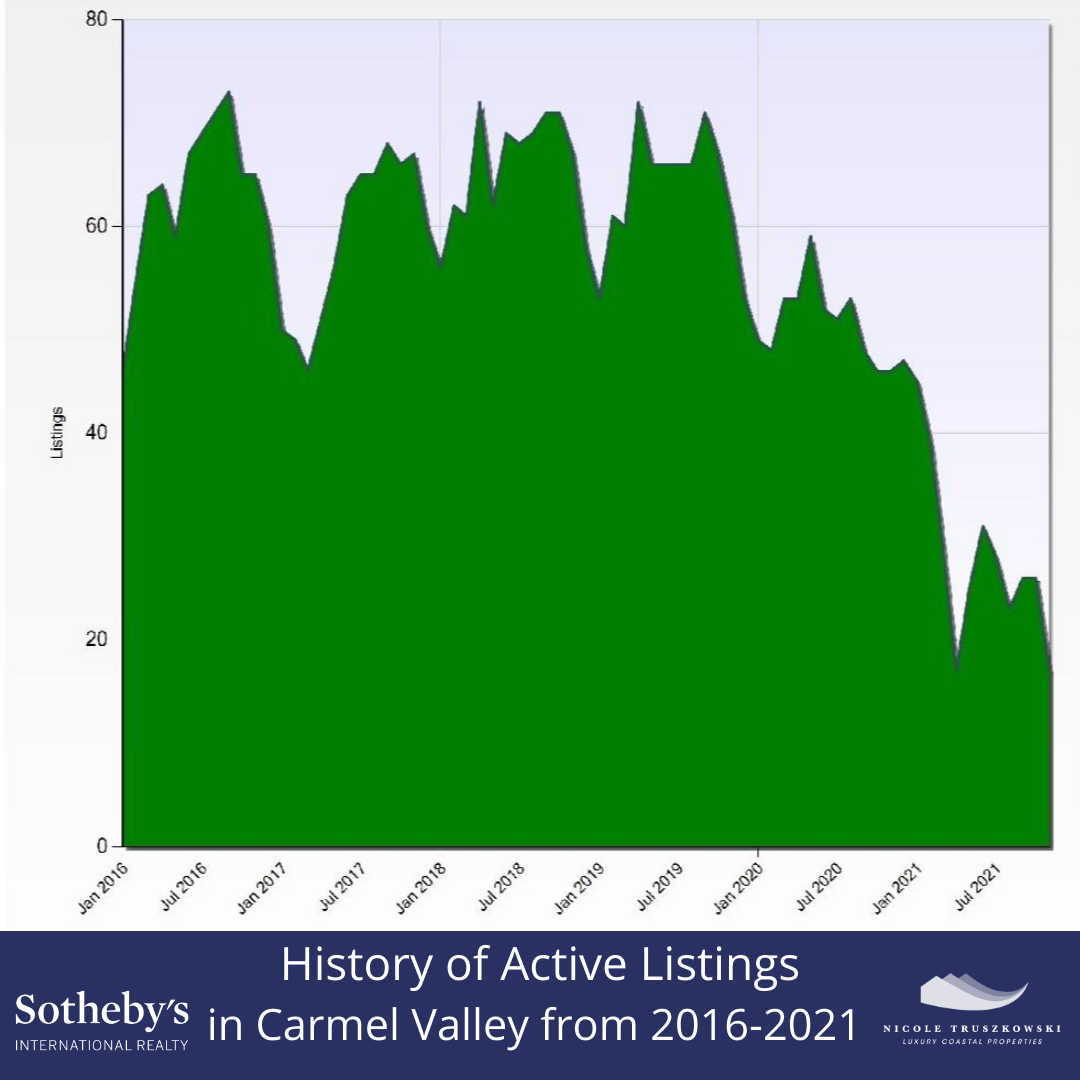
Inventory levels for 2021 on average are down about 54%.
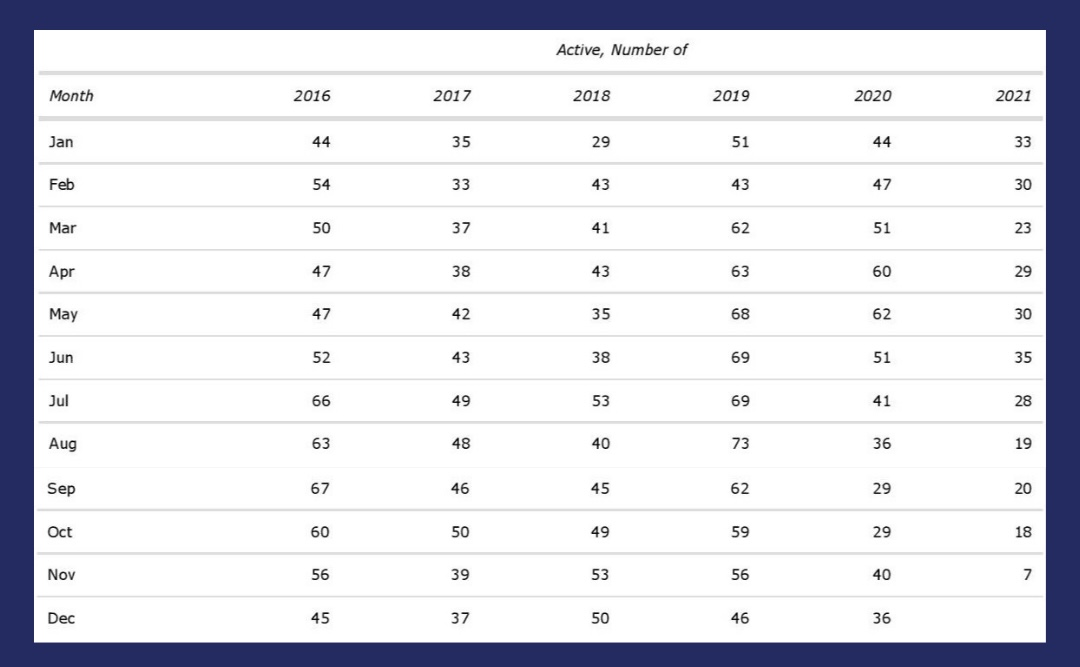
Pacific Grove
Looking at the graphs it shows that the number of active listings in Pacific Grove really peaked in 2019, especially in the summer of that year.
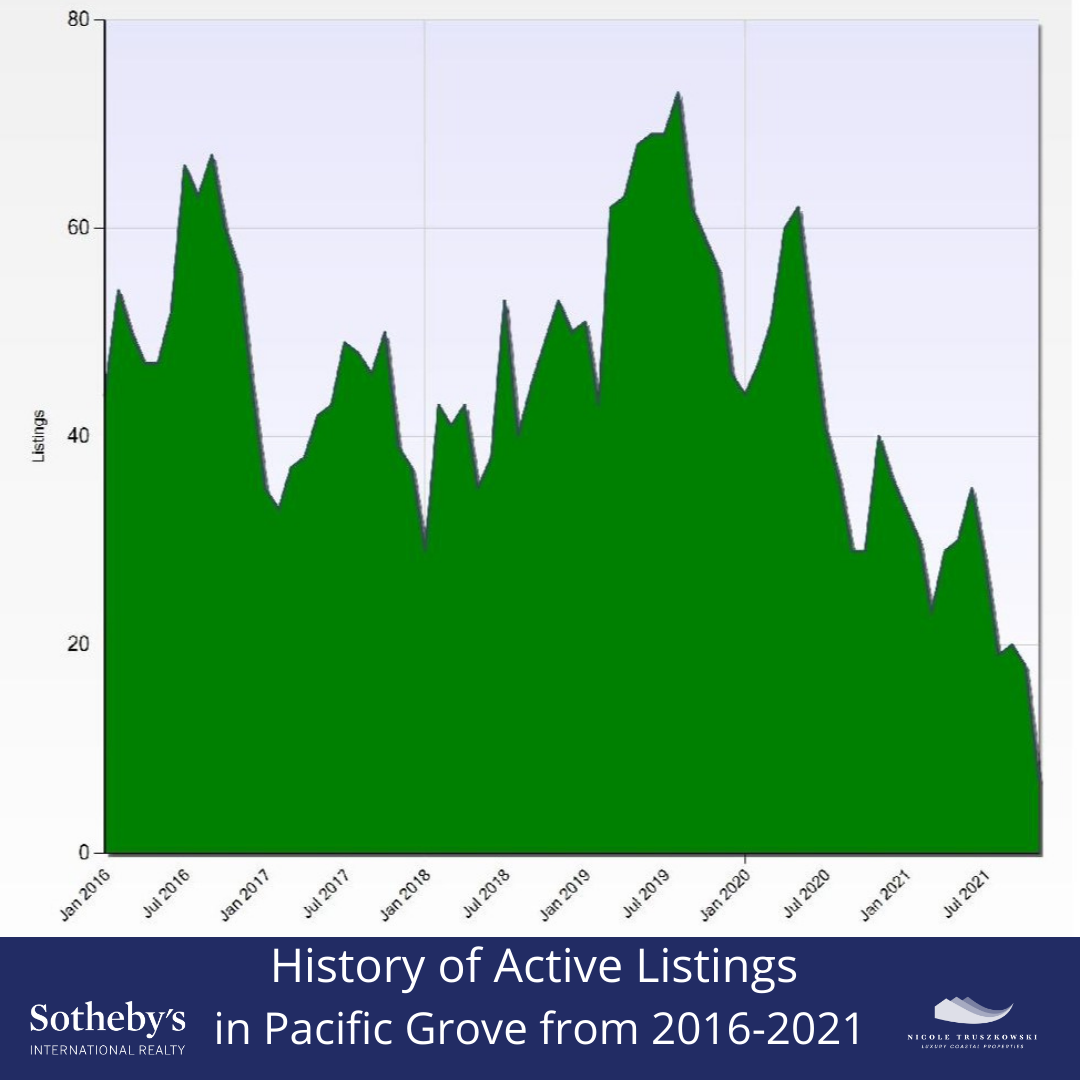
Inventory levels for 2021 on average are down approximately 49%.
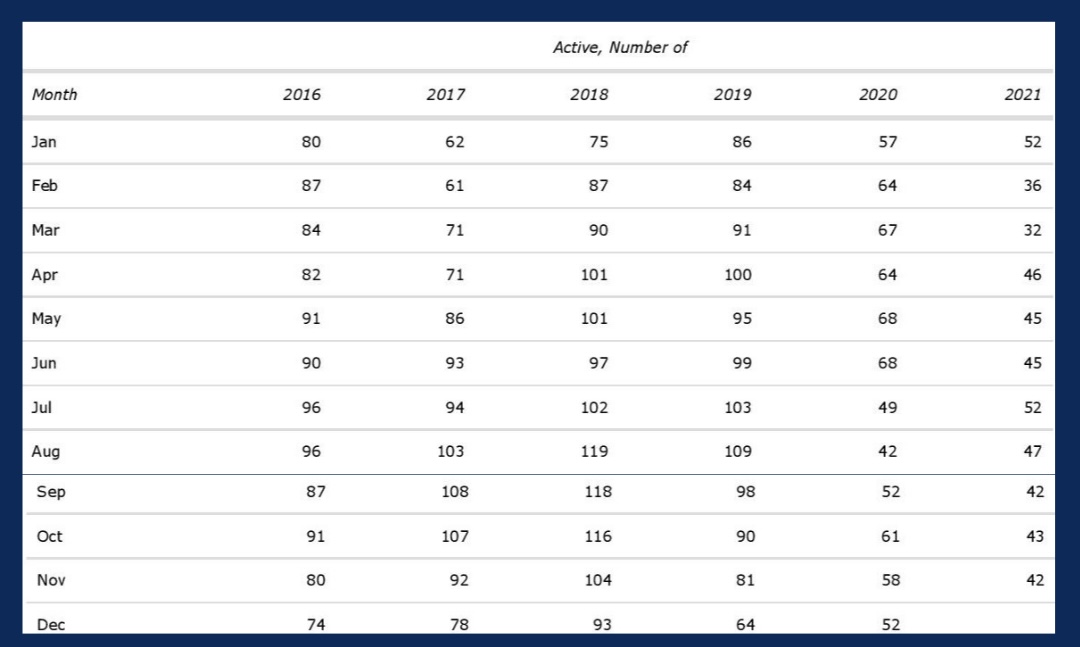
Monterey
Inventory levels in Monterey for the past 5 years have been strong and generally steady.
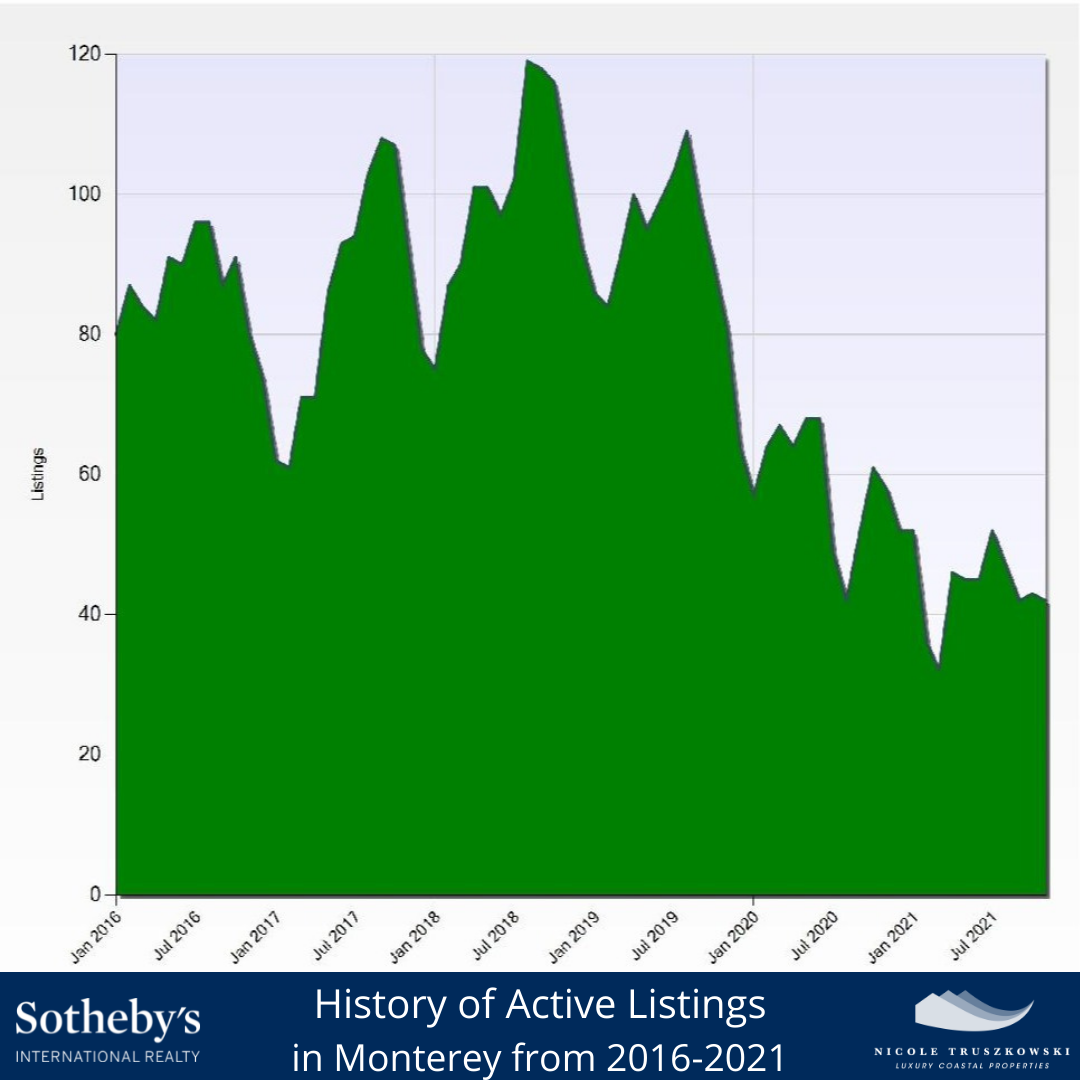
Inventory levels for 2021 on average are down approximately 48%.


Leave a Reply